
Low Interest Rates Created Aristocrats
Everybody knows a couple of somebodies who bought a house during Covid or refinanced on a mortgage(s) that they owed on from before. If you're reading this you know what I'm going to say next. Those golden ticket holders will tell you the rate on that mortgage unprompted, like it's part of their personality. "My name is Jim, I'm married, 2 kids, 2.75% mortgage, like to golf, I'm a lawyer." It's not even meant in a braggadocious way either, it's just a fact about them now. Four years later you'll still hear about the wise decision they made back at the turn of the decade, because a 2.75% mortgage is the closest thing to free money a normal person is ever going to touch.
The window was open about fourteen months, July 2020 through September 2021. By the first quarter of 2022, 65% of every outstanding mortgage in America was under 4%. That's the whole country's housing wealth getting handed out on a timer, and if you weren't ready to buy when the door was open, you didn't get any.
Then the door shut and the inflation that made those rates possible went to work on everything else. Like cheap house lending, rent got cheap for a year or two, but when things returned to normal and people started returning to work, rent didn't drift up. It snapped.
New York rents fell 15% year over year into early 2021, only to then rise 20% by early 2022 (NYC rent prices are truly a jump scare if you're not prepared). Austin went up 24%. Seattle is up a truly astonishing 67% since January 2020, second only to Denver, against 33% for the country as a whole.
So now there are two groups. The people who locked in a rate and will be fine for thirty years, and everybody else was renting into a 20% spike with nowhere to go. And part of the reason there's nowhere to go is that nobody holding a 2.75% mortgage is ever selling. The FHFA actually measured this: lock-in killed about 1.72 million transactions between mid-2022 and mid-2024 and pushed home prices up 7% all by itself. The golden tickets didn't just help the people holding them. They took supply off the board for everybody else.
Many prominent people, in both the private sector and politics—from every end of the ideological spectrum might I add—are calling this a crisis. I'm not sure crisis is the right word. Personally I find the word to be overused and I don't think it accurately describes what this is. It's quieter than what we've been predisposed to consider a crisis in the past, and yet somehow, in some ways, it's much worse, because of how thoroughly it has demoralized the landscape.
A large chunk of an entire generation seems to have lost its shot at the thing that has been the centerpiece of what America has stood for since our founding. Baseball, apple pie, home ownership. A whole lot of people got sorted into haves and out-of-luck by an accident of timing, nobody's offered them much since, and they're right to be annoyed about it.
Rents aren't just flattening. They're falling. Nationally, rents in July 2026 were down 1.1% from a year earlier, after bottoming out at negative 1.6% in April. San Antonio is down 5.2%, the steepest of any large metro in the country. Austin is down 3.7%.
Candidates running on platforms of rent stabilization point to that flattening and call it proof that rent caps work. They're not technically lying either, because a cap does hold rent down inside the apartments it covers. But that part was never in question.
It also isn't what did this. In 2024 the country finished 608,000 multifamily units, the most since 1986, and 95% of them were built to rent. From the second quarter of 2023 through the third quarter of 2025, ten straight quarters delivered more than 100,000 units each. Dallas and Phoenix alone were still turning out more than 4,000 units a quarter this spring. Rents fell because we built, and the places that built hardest are the places where rent is actually falling.
The Fallacy of Building "Affordable" Apartments
Here's where somebody usually says "the new buildings they're putting up are luxury condos and that's what's driving prices up."
It's true, the buildings going up are not for you. They're glass, and they have tours fitted out with amenity decks, and movie rooms, and maybe even a dog spa! And rent at places like this can start at $3,000 for a studio. Unfortunately, and I mean this genuinely, nobody is building the two-bedroom walk-up that was a fixture in sitcoms in the 1990s (I'm writing this while watching Seinfeld actually). So when a guy making $55k a year gets told that the answer to his rent going up yet again is more construction, and every crane in his city is putting up a glass tower he has to crank his neck into an uncomfortable position to look up at, he's justified in feeling like a mark.
Evan Mast, then at the Upjohn Institute, pulled the address histories of 52,000 people who moved into new market-rate buildings across twelve large cities, then traced backward. Who moved into the apartment the new tenant left? And who moved into that one? He followed the chain. His finding: for every 100 new market-rate units built, somewhere between 45 and 70 people move out of neighborhoods below the area's median income, and 17 to 39 out of the poorest fifth. Almost all of it happens within five years. (Evan, if this ever crosses your desk: you traced 52,000 people's forwarding addresses to attempt to settle a zoning argument. You’re insane. And awesome)
Translated: those are vacancies. In the cheap neighborhoods. Created by a building nobody in those neighborhoods could afford. The luxury tower doesn't have to be for you to work for you. It has to pull somebody out of the apartment that is for you.
Mast, along with Brian Asquith, also at Upjohn, and Davin Reed of the Federal Reserve Bank of Philadelphia, went and looked at what happens when you drop a big new apartment building directly into a low-income neighborhood, which is supposed to be the gentrification nightmare the left has been boogeymanning about for a decade. Rents on the surrounding blocks came in 5 to 7% lower than comparable blocks a little farther out or developed a little later. New buildings slow local rent increases rather than initiate or accelerate them. The supply effect beat the amenity effect. The tower with the dog spa made its own neighborhood cheaper; a little rising tide lifting all boats scenario at play here if you will.
And then time does the rest of the work, which is the part almost nobody accounts for. Stuart Rosenthal at Syracuse University measured how fast housing gets cheaper as it ages, using panel data from 1985 to 2011, and found that rental housing filters down about 2.5% a year in real terms. Two and a half percent doesn't sound like anything. Compound it. That $3,000 studio with the dog spa rents for $1,600 in twenty-five years and $1,100 in forty, in today's dollars, in the same location, having never once been touched by a housing program.
The luxury studio becomes the cheap apartment in time
A $3,000 studio filtering down at 2.5% a year in real terms, the rate Rosenthal measured for rental housing. The marked points are year 25 and year 40. Same building, same location, no housing program involved.
That 2.5% isn't a law of physics. Rosenthal found filtering runs slower where prices are inflating fast, and a follow-up study measured it market by market and found that housing filters up in Los Angeles and Washington, DC while it filters down in Detroit and Chicago. Read that again. In Los Angeles, apartments get more expensive as they get older. A fifty-year-old building with fifty-year-old plumbing costs more in real terms than it did when the plumbing was new. That is not supposed to be possible, and it happens anywhere the supply is choked hard enough.
Three out of four eligible low-income renter households in this country receive no federal rental assistance at all. In 2023 there were 8.5 million renter households paying more than half(!!!) their income for housing or living in substandard conditions or both, and getting nothing. There is no version of the near future where Congress closes that gap at anything like the scale it would take. So the honest question isn't whether the government should house poor people. It's what actually houses them right now, today, at scale, without a program.
The answer is actually already here! It's old buildings. The affordable housing in your city is almost entirely housing that was built as expensive housing at one point and then got old. Somebody's grandmother is paying under market in a building that at one time had a doorman. Every cheap apartment in America is a luxury apartment that nobody has called luxury in forty years.
Red and Blue Divergence
Rarely do you get a direct 1:1 comparison in policy. You get one set of policies, one set of outcomes, and a hundred confounding variables, which is why every housing argument eventually collapses into people trading anecdotes about their own rent or their friend's rent. What we do have is fifty comparisons in the form of state law, and many more among cities, though of course with different factors like location—coastal versus inland; proximity to universities—there is a correlation between expensive states and where our top colleges are; and existing and emerging industry—you'll notice a lot of these are saying the same thing. But here is the data via the Census Bureau, over the last decade (up until 2024), per state.
As you can see, there are three baskets here. Twenty-three states have a Republican governor and Republican legislature, known amongst the politicos as a Republican trifecta. Sixteen have Democratic trifectas. Eleven are split, with each of those having a Democratic governor with a Republican legislature, except Nevada and Vermont, where it is an R-Gov and a D-Leg, and Alaska, which runs bipartisan coalitions in both chambers.
The median Republican trifecta state permitted 35.6 homes per thousand residents over those nine years, the split states permitted 28.0, and the Democratic trifecta states permitted 26.5. On what actually got built, though, it is almost identical: 24.8, 25.5, and 24.4. The biggest shock here is West Virginia managed to lose housing units, finishing at -11.5. That would be dragging down the GOP's average, but this table reports medians, which a single outlier can't move. You can sort the table below.
What is permitted vs. what is built, by state
Housing units per 1,000 residents in all fifty states, 2016 through 2024. Permitted counts building permits issued over those years. Built is the net change in the housing stock over the same span, after demolitions and conversions wash out. Statehouse is the party holding the governorship and both chambers, or Split where they are divided. Click a column to re-sort.
| Units per 1,000 residents, 2016-24 | ||||
|---|---|---|---|---|
| State | Statehouse | Permitted | Built | Permits, total |
Sources: U.S. Census Bureau, Building Permits Survey, annual state files, 2016 through 2024, all structure types; American Community Survey total housing unit counts, 2016 and 2024, differenced; 2024 population estimates. Statehouse party is trifecta control in 2026: 23 Republican, 16 Democratic, and 11 Split where the governor and legislature are held by different parties. Figures are statewide, and statewide is generous to the worst offenders: zoning is municipal, so a state’s rate blends its choked metros with its exurbs. Built figures are survey estimates and carry margins of error; treat small gaps as noise. West Virginia is negative because it lost housing units on net.
Statewide however might be the wrong place to look. Government is supposed to run downhill, federal to state to local, each layer narrower than the one above it. Housing actually runs the pyramid upside down. The federal government owns the mortgage market, the state writes the enabling law, and the entity that actually decides whether a building can exist or not is a city council and a zoning board, a zoning board that is typically five appointed people at a Tuesday night meeting with seven to fifteen impassioned people in the audience. The veto lives at the bottom. So if the parties really differ on housing, and on the ease or ability to build it, it wouldn't show up in state averages, which blend Boston with Worcester and San Francisco with Fresno. It would show up in the cities.
And it actually does! Using the same years, below are the twenty-five largest metros in America. Metros in Republican trifecta states permitted a median of 57.7 homes per thousand residents, metros in split states permitted 46.2, and metros in Democratic trifecta states permitted only 24.6. On what got built it holds in the same order: 59.3, 42.2, and 21.0. The near-tie at the state level becomes better than two to one at the metro level, and it descends in the same direction both times you measure it.
Austin—which is the abundance dems favorite case study—permitted 123.6 per thousand and actually built 126.1, more than five times that of New York City's permitting rate. Austin appears to have built slightly more than it permitted, and that gap is inside the survey's margin of error, plus manufactured homes and unit conversions that add housing without a new-construction permit. What it means in practice is that Austin builds essentially everything it approves. NYC permitted 23.6 per thousand and built 10.5. That is the worst conversion rate on the table, and it is the more damning number of the two, because 45% of what New York approves is all that ever becomes a place to live. One caveat on that ratio: the permit column comes from the Census Bureau’s building permit survey and the built column comes from its housing unit counts, so it is two different instruments divided into each other rather than a cohort of buildings followed from approval to occupancy. The gap is far too wide to be an artifact of that, but it is a ratio, not a measurement.
Austin, TX vs. New York City, NY
Housing units per 1,000 residents, 2016 through 2024. Permitted is what the government allowed. Built is the net change in the housing stock over the same years.
What is permitted vs. what is built, by city
Housing units per 1,000 residents in the twenty-five largest metropolitan areas, 2016 through 2024. Permitted counts building permits issued anywhere in the metro area. Built is the net change in the metro’s housing stock over the same span. City is the party of the principal city’s mayor; State is the party controlling the statehouse. Click a column to re-sort.
| Governed by | Units per 1,000 residents, 2016-24 | ||||
|---|---|---|---|---|---|
| Metro | City | State | Permitted | Built | Permits, total |
Sources: U.S. Census Bureau, Building Permits Survey metropolitan-area files, 2016 through 2024; American Community Survey total housing unit counts, 2016 and 2024, differenced; population from the 2024 ACS. City party is the principal city’s mayor as of August 2026: Dallas (Eric Johnson, who switched parties in 2023) is the only Republican-led principal city here, and Fort Worth’s mayor is also Republican. Miami shows Democratic because Eileen Higgins took office in December 2025, but the city was Republican-led for every year the data covers. Metro boundaries were redrawn in 2023, so built figures absorb the redefinition. Built figures are survey estimates; treat small gaps as noise, including where built slightly exceeds permitted.
Of the twenty-five cities in the city table, twenty-four have Democratic mayors. As of August 2026, sixty-seven of the hundred largest cities in America are run by Democrats versus only twenty-two by Republicans. The only Republican-led principal city on the table is Dallas, and that is only because Eric Johnson switched parties in 2023, one term into the job. Miami is flashing as Democratic because Eileen Higgins was sworn in this past December and is the first Democrat to run Miami since 1997, which means every year of data in the table describes a Miami under Republican mayoral rule.
So the cities are not the variable. Austin, Houston, San Antonio, Charlotte, Atlanta, Orlando, Tampa and Phoenix all have Democratic mayors, and all of them out-build Boston, San Francisco, Chicago and New York; several by a factor of three or more. These are Democrat-run cities in Republican states. The mayors are not inherently different—of course there are divergences on ideologies within parties, but the common tenets of what a Democrat or Republican is, is mostly the same. What is different is that these states never built the machinery a city needs to say no. That is the subject of the next section.
Three metros in Democratic or split states build at Sunbelt rates: Denver at 63.7, Seattle at 54.0 and Minneapolis at 46.2. Denver is the one that surprised me most, and the explanation is pretty easy and was due to a single decision. In June 2010, then Mayor John Hickenlooper and city council threw out its zoning code and wrote a new one that upzoned most of the city. Before that Denver was a construction laggard; after it, the place has boomed. As someone who has been to Denver twice—both for AFC Championship games featuring the home town Broncos and my New England Patriots—in January 2016 and 2026 respectively I have seen firsthand the boom in the city with new townhomes and multifamily properties taking up every corner of every street.
The other direction has its own explanations. Philadelphia sits at 23.5 in a state with a Republican legislature, and one can hypothesize that a lot of that is contract related. St. Louis sits at 24.6 because not enough people currently want in; supply is not the binding constraint in a region demand left decades ago, and I'd expect that to change as the area gentrifies—slowly and then suddenly—the way that always goes.
Miami is the one to watch. At 28.5 it now sits above New York, Boston, San Francisco, Los Angeles and Chicago, and it did that with only two of these nine years spent under a law that preempted its own zoning. Seven of the nine years in that number are the old Miami.
To add some additional and needed context, the built column ends in 2024, because the survey it comes from publishes on a lag and the 2025 numbers arrive next month (maybe I should have waited to take on this endeavor until then), so this is the freshest reliable data available. What I can say is that metro permits nationally ran 1,425,096 in 2024 and 1,380,237 in 2025, and the first half of 2026 annualizes to 1,397,692. Which is flat, not recovering. Austin's own pace has fallen from 12.7 per thousand in 2024 to 10.6 in 2025 to 8.2 through June of this year. NYC is running 2.9, San Francisco is running 1.7.
One note: recent data is showing the order not changing, but the volume as a whole going down across the board. This is not explicitly what this paper is about, but I do want to try to explain away potential reasoning for it. Outside of policies and regulations, there are market factors and inflationary aspects that are disrupting a lot of areas in the economy. There are some workarounds available to state and local governments for some of these, but they would incur both a real cost as well as exhaust a lot of political capital, and the payoff is not guaranteed, immediate, or even really existent within one electoral cycle, so a safe assumption is the wave has to be ridden out.
The Bureaucrat Snail Betrayal
Every blue state in the country has now passed a bill that sounds and appears like the answer, and on its face it might be. The bills are real, but what sits underneath them is a set of procedures that let a very small number of people impose a very large amount of delay, and delay is much cheaper than opposition.
The Minneapolis 2040 Plan almost didn't survive. In September 2023 a judge blocked it, ordering the city to stop applying the plan because Minneapolis had never done an environmental review, in a lawsuit brought by an environmental nonprofit (good job guys!), and more than thirty developments holding over 500 homes stopped where they stood. It only was rescued because the legislature buried a retroactive exemption for comprehensive plans inside a 1,400-page bill in the closing hours of the 2024 session. A Hennepin County judge dismissed the case in January 2025 and the Minnesota Supreme Court thankfully declined to look at it.
That sequence is not unique to Minnesota (which now is getting about as many words in this as they have lakes), it is a sequence that has taken place in many places before it, and likely many places after. A celebrated housing reform is passed, a climate nonprofit selectively files paperwork and it halts it from being legal for a time, and the only thing that saves it is the legislature. This doesn't play out as quickly as it's written out though. It takes months, if not years.
California is the clearest case, because California tried hardest. This next part is going to be a very brief overview about what Abundance by Ezra Klein and Derek Thompson is all about; The California Environmental Quality Act (CEQA), was signed into law by then Governor Ronald Reagan in 1970—yes that Ronald Reagan—to make the state disclose the consequences of what it built. If you haven't heard of CEQA, congrats! Very few laws have had as good of intentions but have done as much damage as it has.
Holland & Knight has now run three studies on who actually gets sued under it. In the region of Southern California, a third(!!) of all CEQA lawsuits targeted approved housing projects. Of the housing units targeted, 99% were infill—meaning they were going on unused land inside places that were already developed—and 71% were higher-density multifamily. In 2020 alone, CEQA lawsuits sought to block roughly 48,000 already-approved homes, just under half of everything California built that year.
In June 2025—better late than never—Governor Gavin Newsom signed into law AB 130 and SB 131, two of the most pro-housing bills in the history of the country. They do—amongst other things—exempt qualifying infill housing from CEQA outright on sites up to twenty acres, have no affordability mandate, no prevailing wage requirements on buildings under eighty-five feet tall (a major one that has restricted building in LA in particular), and a thirty-day clock—which is lightspeed for governmental decisions—for the agency to say yes or no. In October, the state passed SB 79, which upzones everything within a half mile of a transit stop, and that took effect six weeks ago. On paper, California genuinely now has the most aggressive pro-housing law in the country.
We will have to wait for a true view of the numbers in the next year or two, and it will be a future governor that reaps the benefit of the bill, as Gov. Newsom is term-limited and likely running for a new office on the East Coast in 2028. But here is where we are now. California permitting bottomed in the first half of 2025—the very months before AB 130 and SB 131 were signed—when the state issued 49,400 permits, a pace that would have been its lowest year since 2014. But it has risen every period since: 104,626 for all of 2025, and 56,709 in the first half of this year, which annualizes out to 113,418. San Jose has gone from just 1,998 permits in 2024 to a pace of more than double—4,556—now.

San Francisco is where it hasn't worked. The city permitted 750 (!!!) homes in 2024, 1,644 in 2025, and is annualizing 1,454 this year. The state argues that San Francisco needs 82,069 units, which is a little over ten thousand a year. Even now, after the most aggressive pro-housing law in the country, San Francisco is permitting at roughly 14% of what it has been directed to build.
So CEQA is a very clear and real constraint, and getting it at least somewhat out of the way has moved real numbers. What it is not, however, is the only constraint; San Francisco is proof of that. Doubling a different city that starts with San—San Jose's—permits gets you to a number that matters, while doubling San Francisco's gets you to a measly ~1,450 against a requirement of almost ten thousand a year.
CEQA was step one, but with San Francisco you have the following things still acting as red tape that makes building housing hard. There is the transfer tax, the inclusionary requirement, the design review board, the fee schedule, of course an appeal, then the appeal of the appeal, the potential neighbor who retains counsel, and a city government that still holds immense power no matter what the state says, because California's charter cities have constitutional authority over their own affairs and they will litigate to the last inch over whether housing counts as one. Each one can cost a developer months, and they never run concurrently—what I mean by that is they are strategically set to go one after another instead of happening at the same time. Remove the largest obstacle in CEQA and the other eight are still standing strong. Zoning decides what you are allowed to build. Underwriting decides what gets built, and those are two different offices. Permission is not capital.
Washington State is a place that can prove the point from the other direction, and it's a comparison I found most useful while working on this piece. Washington has its own version of CEQA, the State Environmental Policy Act, passed in 1971. Even so, Seattle currently permits at more than double the rate of San Francisco. Seattle is an easy case study to attack from any angle you want but the issue is demand. Tech exploded in the city and people migrated from Silicon Valley, from Cambridge, from New York, from DC, and from international markets to work at start ups turned trillion dollar enterprises and with that more start ups sprouted. The issue has always been demand, and supply has to keep up with it. The difference between Washington State and California is not the existence of the statutes, it is in three design choices.
First, Washington took housing out of the process. State law lets any city planning under the Growth Management Act (passed in 1990) raise its exemption thresholds for residential and mixed-use development inside urban growth areas, on the theory that the comprehensive plan already did the environmental analysis. Amendments added in 2025 put in a further exemption for residential buildings within a half mile of a rail station or a quarter mile of a bus rapid transit stop. California had no equivalent until thirteen months ago: a project could match a general plan that had already been reviewed and still owe its own review—a review of a review.
Second, Washington lets the review happen once for an entire area rather than once per building. A city prepares a single environmental study for a subarea, and individual projects inside it don't need their own, which is likely self explanatory but in theory makes things much more efficient and easier to streamline.
Third, and the one that probably matters most is who gets to object, and where the objection goes. CEQA is built for broad public enforcement, so essentially anyone with an environmental concern can file suit in superior court. Under SEPA, a challenger has to demonstrate standing, has to exhaust administrative remedies first, and lands in front of a hearing examiner who gives the city's original determination substantial weight. California hands the veto to any individual with a filing fee, while Washington hands it to a professional adjudicator who begins by deferring to the city.
Massachusetts has a different disease: its state legislature. Its environmental review thresholds are high enough that most housing never triggers them, so the constraint there was never environmental. Up until January 14, 2021, Massachusetts law required a two-thirds town vote to change a zoning bylaw — meaning a third of the people in the room held a veto over the other two-thirds, in every one of its 351 cities and towns. That is the cleanest single explanation for why Massachusetts sits third from the bottom of the state table. The Housing Choice Act finally cut it to a simple majority for pro-housing changes—but excluded Boston, which runs under its own zoning act. The state fixed the rule everywhere except the place with the most people who needed it fixed.
California is now watching the same thing happen in real time. SB 79 took effect on the first of July, and the cities did not wait for it. Beverly Hills submitted an alternative compliance plan and the state rejected it on May 8. San Jose obtained an approved exclusion ordinance on June 4. Los Angeles and San Francisco are pursuing permanent industrial-hub exclusions. Palo Alto is using temporary capacity exclusions. The state upzoned, and the paperwork to get out from under it was filed before the law was ever in force.
The federal government tried too, and the attempt shows the ceiling. Very recently, on June 22, the Senate passed the 21st Century ROAD to Housing Act by a bipartisan margin that is eye-popping: 85 to 5, with the House following suit (358 to 32) the next day. It is a real bill—permitting reform, capping institutional investors with limits on buying single-family homes, a rewrite of federal programs that badly needed one—and it became law on July 11 without a signature, after the President called it "a big yawn" and demanded the SAVE America Act be passed in exchange. There are fifty-odd provisions in this thing, and it is without a doubt the most comprehensive federal housing legislation in at least three decades, but not one line of it can tell a zoning board in Palo Alto what to do. I don't blame the bill for that though; land use (not including eminent domain) is not a federal power. But it means the largest housing law Congress has passed in a generation is structurally unable to touch the thing that in practice actually decides whether a building exists.
So the question was never whether a state has an environmental statute, a zoning reform, or a housing bill. It is how many separate parties can impose delay, how cheaply they can do it, and how many times they can do it per building. Every place that has moved its numbers moved that one variable and typically nothing else. Which raises the question I've been filibustering about for five thousand words now: if the red tape is the problem, how much of it should exist at all?
Game of Zones
My opinion is simple: Zoning should not exist except to protect places that are genuinely historic. Or in places of great public use. Everywhere else, build.
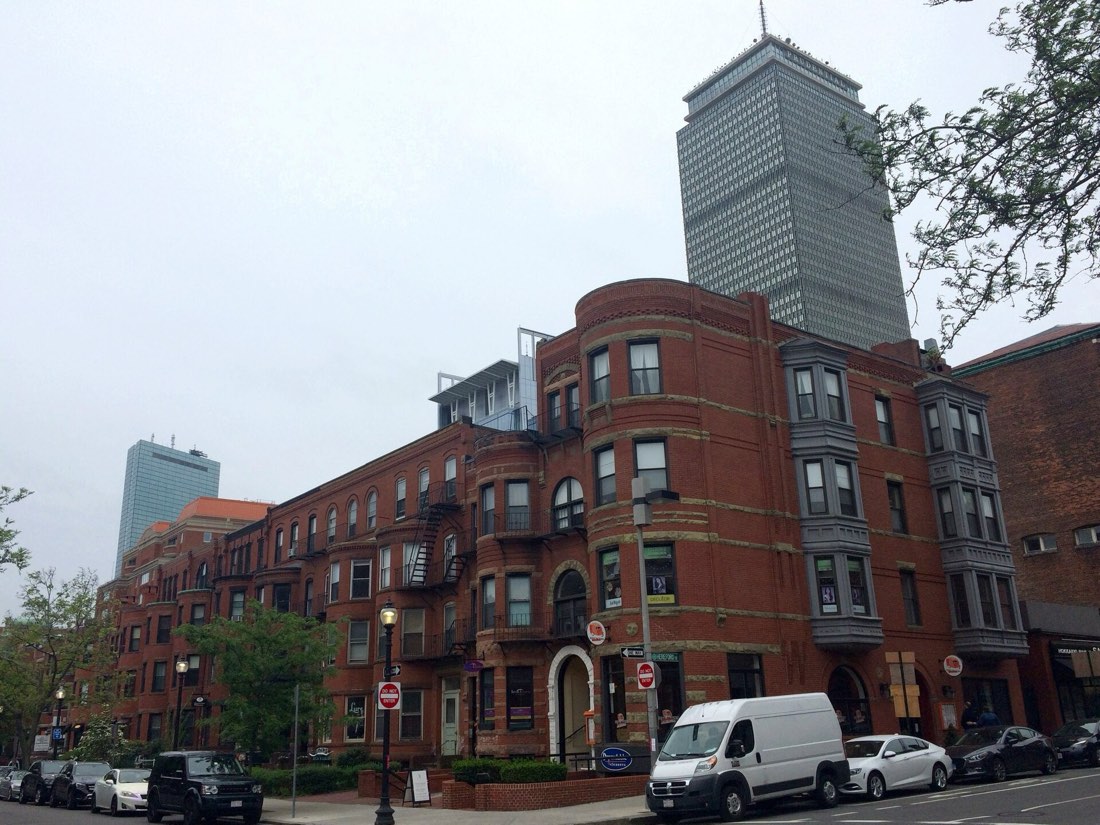
Beliefs and opinion play into the above and I do want to briefly explain mine. I do not want the brownstones of Back Bay in Boston (try to say that 10 times in a row) to come down. I do not want Hollywood to change. I want Central Park to stay a place where individuals and families can enjoy a Saturday in the park in New York City, while listening to "Saturday in the Park" by the band Chicago. I want the most historic parts of America that still exist to stay America—outside of being put inside of a museum—and I don't think that requires an economic justification. It is a value, I hold it, and I believe it is worth the cost to maintain those aspects.
I also think America is the most beautiful country on earth, and that our national parks, state parks and wildlife preserves are important to maintain. I do not want to build on them, and I don't think any serious person is proposing to as of yet.
And the costs aren't low. The Furman Center at NYU went and measured what happens to construction after a neighborhood gets historic district designation in New York, and found that new units per year drop by about fourteen per district citywide, and twenty-two per district in Manhattan. Local designation produces more permitted renovations and less new construction and less subdivision. The authors are careful to say they cannot prove this reduced New York's total housing supply rather than pushing it somewhere else, and that is fair. But New York has 113 historic districts, and "somewhere else" is a finite resource. That is not an accident of the policy, but rather the policy working exactly as designed. Preservation perseveres.
Boston is what happens when you scale that preservation up. There are more than nine thousand properties in Boston that are either individual Landmarks or sit inside one of nine local historic districts, and those designations run on a completely separate track from what most think of when they hear of zoning. Landmarks approval does not substitute for zoning relief and a zoning variance does not override Landmarks. Zoning variances and Landmarks are actually two separate and independent bodies and you have to clear both or you build nothing. But notice where Boston actually has grown since 2000; the Seaport district. The name speaks for itself, this was former industrial land and surface parking on the South Boston waterfront, which is to say the one part of Boston with no historic fabric to protect and nobody with standing to object.
The only place in the city with nothing to preserve is the only place that got built, and build they did. Since 2006 the Seaport has delivered more than 2,500 residential units, on top of over $3 billion in completed construction, roughly 10,000 construction jobs and 20,000 permanent ones. Seaport Square, the largest single project, is planned at about 3,000 residential units across 2.6 million square feet of housing inside a 7.6 million square foot masterplan on 23 acres. Massport's own partnerships account for nearly 7 million square feet and about 1,800 apartments over two decades. One number does stick out though: of those 2,500-plus units, just over 160 are affordable rentals. Roughly 6%.

The other side of this is Houston, which is the only large city in America with no zoning at all. In 1998 it went further and cut its minimum lot size in the urban core from 5,000 square feet to 3,500, and to 1,400 for parcels meeting certain open space standards. More than 25,000 homes went up on lots under 5,000 square feet between 1999 and 2016. Researchers put the benefit to a typical Houston household at roughly $18,000, with lower-income households gaining more than higher-income ones. By 2017 the median new townhome ran about $313,000 and the twenty-fifth percentile was $156,000. Houston permitted 54.5 homes per thousand residents from 2016 through 2024 against San Jose’s 17.8, better than three times the rate, and in 2019 it permitted roughly as many apartments as Los Angeles, a city nearly twice its size.
Houston might lack some of the beauty that some of the other cities in this piece have, but is the only major American city where a schoolteacher can actually buy a house near where he or she works, and those two facts are related.
An objection I take seriously, and one that is often made; if you strip zoning, what stops a wealthy town from simply buying the land and sitting on it? To be honest, nothing. This happens in places all over the country. We see it most often at country clubs, where some of the best golf courses in the nation occupy some of the most expensive real estate in the nation. It became a topic of discussion online briefly during the 2023 US Open at Los Angeles Country Club, which sits on 320 acres beside Century City where building lots go for about $25 million an acre. The land is worth around $8 billion. It is assessed at $22 million and pays about $220,000 a year in property tax, when market value at California's 1% rate would put the bill closer to $80 million. That is not a loophole anybody stumbled into either — a 1960 ballot measure, campaigned for by Bob Hope under the slogan "Keep California Green," specifically exempted private nonprofit golf courses from being assessed at their highest and best use. In a deregulated market nothing forces anyone to build. Someone with money can purchase every empty parcel around them and hold it vacant forever, and they will get the same exclusion zoning gave them without a single public hearing.
My answer is a land value tax on vacant land. Not on parking lots, which are in use, and not on anything with a building on it. On empty lots held without intent to build. Buy a lot, sit on it past some number of years, and the tax rate on the land goes up. Nobody seizes anything. There is no confiscation. You simply pay more for the privilege of keeping useful land out of use, and if you want to hold it anyway, you can. It just costs.
The mechanism behind this is older than I am and better supported than most housing policy. A tax on land cannot be passed through to a tenant the way a tax on a building can, because the supply of land is fixed. Raise the tax on structures and owners build fewer structures. Raise the tax on land and the quantity of land does not change, so the tax falls on whoever is holding it. That is the entire Georgist argument in two sentences, and when the Chicago Booth panel polled fifty leading economists on whether shifting property taxes toward land and away from improvements would improve incentives to develop, agreement was close to universal, which is not a thing you often see in that survey.
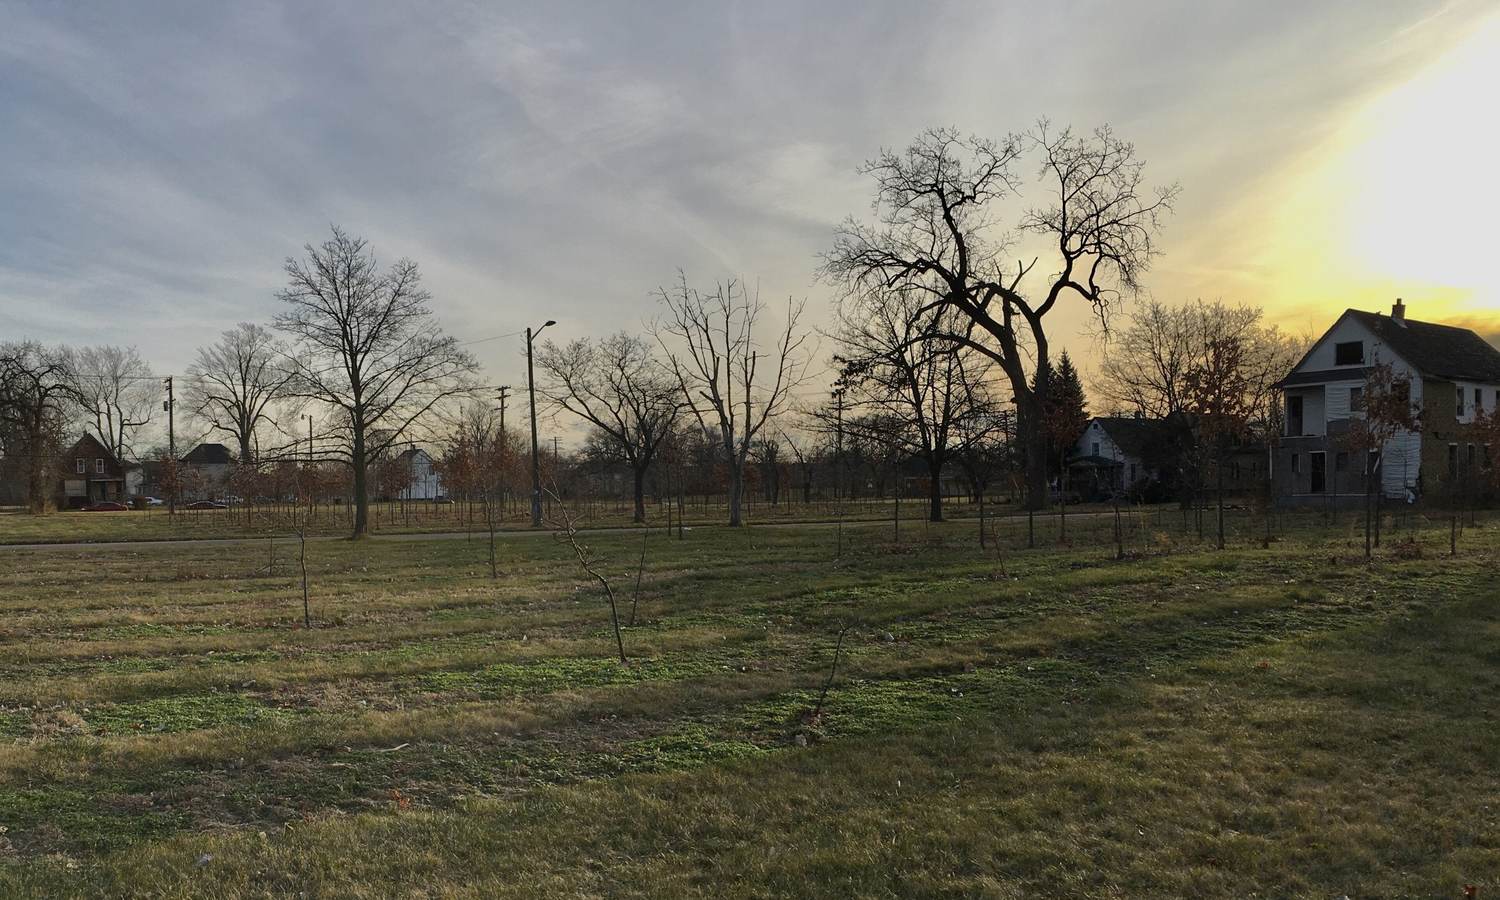
It has been tried, unevenly. Pittsburgh ran a split-rate system from 1913 to 2001, taxing land at 5.77 times the rate of buildings, and outperformed comparable cities on the value of building permits issued while it was in place. What killed it was not the theory. It was that Pittsburgh let its property assessments rot for decades until nobody trusted the numbers the tax was calculated from, which is a warning about administration rather than about the tax. Detroit tried to revive the idea in 2023, proposing to cut the millage on buildings from 20 to 6 while doubling the rate on land. The state legislature never let it out the door.
There is one more piece, and it is the cheapest reform on this list. Wyoming passed a Fast Track Permits Act this year that sets a 30-day deadline on building permit decisions, and if the city misses the deadline the permit is automatically approved. Georgia signed a 60-day version in May. Neither one changes what you are allowed to build. They change what happens when the government does nothing, which flips the default from no-unless-permitted to yes-unless-refused. Every other reform in this piece requires an affirmative act by somebody who does not want to perform it. A shot clock with automatic approval requires only that the clock run out, and clocks are very reliable.
Kansas legalized single-family homes, duplexes, townhomes and ADUs by right this year. Idaho legalized single-stair apartment buildings, which sounds like nothing and is actually one of the most consequential things on the list, because the American double-stair requirement is a large part of why small apartment buildings stopped being economical to build. Indiana made single-family homes, duplexes and in-home ADUs permitted uses with no public hearing required. Virginia did a bipartisan package covering ADUs, manufactured housing and parking near transit.
Five states that changed in 2026
| State | Law | What it changes |
|---|---|---|
| Wyoming | Fast Track Permits Act | 30-day deadline on a building permit decision. Miss it and the permit is approved automatically. |
| Georgia | Permit shot clock | 60-day version of the same, signed in May. |
| Kansas | By-right housing | Single-family homes, duplexes, townhomes and ADUs legal by right. |
| Idaho | Single-stair reform | Legalizes single-stairway apartment buildings, which the double-stair rule had made uneconomical at small scale. |
| Indiana | Permitted-use reform | Single-family homes, duplexes and in-home ADUs become permitted uses with no public hearing. |
| Virginia | Bipartisan package | ADUs, manufactured housing, and parking requirements near transit. |
Sources: state session laws as enacted in the 2026 legislative sessions.
None of that is radical. It is the country slowly noticing that it made building illegal by accident, one ordinance at a time, over about seventy years, and beginning to undo it in the same increments. I would go faster. But it is moving.
What About The "Affordable" Housing
To begin this section, I want to make clear that I'm not against subsidized housing, I think it serves a very important part of society and is extremely needed especially for some of our seniors and those in the disabled community. The main part that gives me pause is where we have decided to put that housing and how we have decided to finance it.
The dominant model in American cities right now is inclusionary zoning. To paint the picture: a developer wants to build a hundred apartments, and the city says okay, but twenty of them have to rent below market rate at a certain percentage for the next several years to several decades. It sounds costless because no public money changes hands. For this, sometimes there are tax breaks or other mechanisms to oil the wheels of developers to get them to buy in. It isn't exactly an unpopular method. A city council can announce affordable housing without appropriating a dollar.
The lack of appropriations does not mean it is costless, however, because it is a tax; instead of currency, this is a tax collected in units, and it lands on the one activity the city claims it wants more of. At UC Irvine a research study put a number on it: California's typical inclusionary requirement reduces annual residential construction by close to a third, and each one-percentage-point increase in the effective implicit tax an ordinance imposes cuts new housing production by about 7%.
This could be a problem native to California though, because national studies looking across many municipalities have found that inclusionary policies on average did not measurably change permits or rents. Even in the aforementioned California, Los Angeles runs a version with tiered density bonuses that appears to have encouraged development rather than suppressed it, because the city gave something back in exchange for what it took. Design matters enormously here, and a mandate paired with a real density bonus is a different animal than a mandate imposed on its own. San Francisco requires any project of ten units or more to either build 12% of its units below market on site, build 20% off site, or pay into an affordable housing fund, and it hands the developer nothing back in exchange. Los Angeles, through its Transit Oriented Communities program, offers a density bonus of 50% to 80% above what the zoning would otherwise allow, in return for the affordable units. San Francisco reduces what a project earns without changing what it is allowed to build. Los Angeles increases what it is allowed to build to pay for what it gives up. Same policy on paper, opposite arithmetic for anyone deciding whether to break ground.
Program Design and Implementation
San Francisco · Inclusionary Housing
- Applies to
- Any project of 10 units or more
- Below-market requirement
- 12% on site, 20% off site, or a fee into the affordable housing fund
- Given back in exchange
- Nothing. The project may build exactly what the zoning already allowed
Los Angeles · Transit Oriented Communities
- Applies to
- Projects within a half mile of a major transit stop, graded into four tiers
- Below-market requirement
- 8% to 11% of units at extremely low income, or 11% to 15% at very low income, rising with the tier
- Given back in exchange
- 50% to 80% more density than the zoning would otherwise allow, rising with the tier
The overwhelming majority of affordable housing in this country is not affordable because a program made it affordable. It is affordable because it got old.
So put the subsidy where the cheap housing already is. Older buildings, in older neighborhoods, in the existing stock, where a dollar of assistance buys a whole unit instead of buying twenty percent of a new luxury one. Do not staple it to new construction, because new construction is the most expensive place in the entire housing system to manufacture a discount, and because when you tax new buildings to produce affordable ones you get fewer of both.
The instrument for that already exists and it is the housing voucher. In 2022 the Housing Choice Voucher program cost about $30.4 billion and served roughly 2.3 million households. The Low-Income Housing Tax Credit runs around $13 billion a year and produces buildings, but LIHTC rents are frequently still too high for the poorest households, which is why cities routinely staple project-based vouchers onto LIHTC units to get the rents down far enough to matter. We are subsidizing construction and then subsidizing the rent in the building we just subsidized.
There is a real problem with vouchers though, and it is the same problem as everything else that I am writing about. A voucher is demand. If you inject demand into a market that cannot add supply, you do not get affordability, you get higher rents. And that shows up in the data: across the ninety largest metropolitan areas, voucher expansion has raised rents by an estimated 16% on average, which is precisely what you would expect where supply elasticity is low. Earlier national studies of voucher expansions found little effect on market rents overall, so the finding is contested, but the direction of the disagreement is instructive. Vouchers look harmless where there is slack and harmful where there isn't. The historical data provides the context, but this can be dumbed down to the foundations of economics and markets: supply and demand.
Which means vouchers are not an alternative to building. They are what you do after you have made building possible. Hand out vouchers in San Francisco and you have funded a bidding war over 1,454 permits. Hand out the same vouchers in Austin and they buy actual apartments, because Austin has built the apartments.
That is the sequence, and I think the order is the argument. Build first, subsidize second, and put the subsidy in the old stock where it goes furthest. Right now in many places, we are doing that list backwards.
The Popularity of Freezing The Rent
The campaign for Saint Paul's rent cap was called Keep St. Paul Home, and the coalition behind it was Housing Equity Now (Saint Paul): the West Side Community Organization, the Frogtown Neighborhood Association, ISAIAH, the Minnesota Youth Collective. Grassroots neighborhood groups. They talked to people at doors, farmers markets and large community gatherings and were able to gather more than nine thousand signatures by hand to get the question on the ballot. To do that and all additional messaging they spent about $213,000. A lot of the signature gathering was done via volunteer manpower.
The campaign against it was called the Sensible Housing Ballot Committee, funded by developers and the Minnesota Multi Housing Association. It raised $3.9 million against the Saint Paul measure. Most of it went to a consulting firm for polling, canvassing, phone calls, and advertising.
A volunteer operation with $213,000 beat a professional campaign with $3.9 million, by six points, on a ballot question. That is an eighteen-to-one spending disadvantage on the winning side. Whatever you think of the policy, the winning side rolled up their sleeves and spent what they had on outreach. Rent had done what rent did, somebody finally put a measure in front of these people that promised to stop it, and they knocked on enough doors to win.
Which is what makes what happened next so damning. Nobody outspent Saint Paul into a reversal. There was no second referendum. The city implemented the ordinance in May 2022, and eight months later its own city council started dismantling it: vacancy decontrol so rents could reset between tenants, a full exemption for income-restricted affordable housing, and a twenty-year exemption for new construction. In May 2025 the council made the new construction exemption permanent. What survived is a cap on old buildings and an off switch for new ones.
The numbers they were staring at were these. Saint Paul had come off its two best building years since 1970, permitting 2,077 units in 2020 and 2,120 in 2021. The cap took effect in May 2022 and permits fell to 1,169 that year. Across the river, borrowing from the same lenders at the same rates, Minneapolis went from 3,182 to 3,681 over the same twelve months. Rates caught up with both cities after that and by 2024 each had cratered, so I won't pretend the cap explains everything that followed. But in the one year that isolates it, the two cities moved in opposite directions.
Minneapolis vs. Saint Paul, permits in 2021 and 2022
Saint Paul’s 3% rent cap took effect in May 2022. Rates caught up with both cities afterward and by 2024 each had collapsed; these are the twelve months that isolate the policy.
And it wasn't only renters who paid for it. The median sale price of an apartment unit in Saint Paul peaked in 2020 at $160,525 and by 2025 was down to $103,249, a 36% decline in real dollars. Apartment owners in total paid 27% less in property taxes in 2025 than in 2022, down from $141M to $103M. What that money was needed for did not just disappear; the city still had to run its schools and plow its streets, and residential housing is 71% of Saint Paul's property tax base, so when the apartment half sinks the house half picks up the slack. The annual bill on the median-priced single-family home went from $3,442 to $4,264. More than $800, moved off apartment buildings and onto homeowners, by a measure voted in to help renters.
Saint Paul apartment values and homeowner tax bills, 2020 to 2025
Per-unit apartment values fell by more than a third and apartment owners’ property tax burden fell with them. Residential housing is 71% of Saint Paul’s tax base, so the median single-family homeowner picked up the difference. The two panels are scaled separately; the dollar amounts are not comparable to each other.
Apartment value per unit
Down 36% in real dollars.
Median single-family tax bill
Up $822, on the same tax base.
And none of it was abstract. Highland Bridge was supposed to be a redevelopment of the shuttered Ford assembly plant site in the city. After rent stabilization passed, the developers of a large market-rate building there suspended construction for years. No building meant no new tax increment, and that increment was what was going to finance the affordable housing on the same site, so the affordable units were stalled too. The cap didn't just stop the market-rate building, it took the subsidized building down with it. The city permanently exempted new construction in May 2025, and in June 2026 Ryan Companies broke ground.
A Democratic council, in a Democratic city, in a state with a Democratic governor, looked at its own permit numbers and took apart the thing its voters had just passed. Not because the landlords won. The landlords had already lost, publicly and expensively. Because the numbers came in.
But none of that stopped the idea. It has gotten bigger. The housing policy debate is on a spectrum and it seems like there is a lot of willingness to try new-ish things. I say new-ish because some of these actions are attempts at revamped industrial era accelerators (what I mostly align with) and others are attempts to institute price control measures, applied more broadly and more powerfully than we have seen in quite some time.
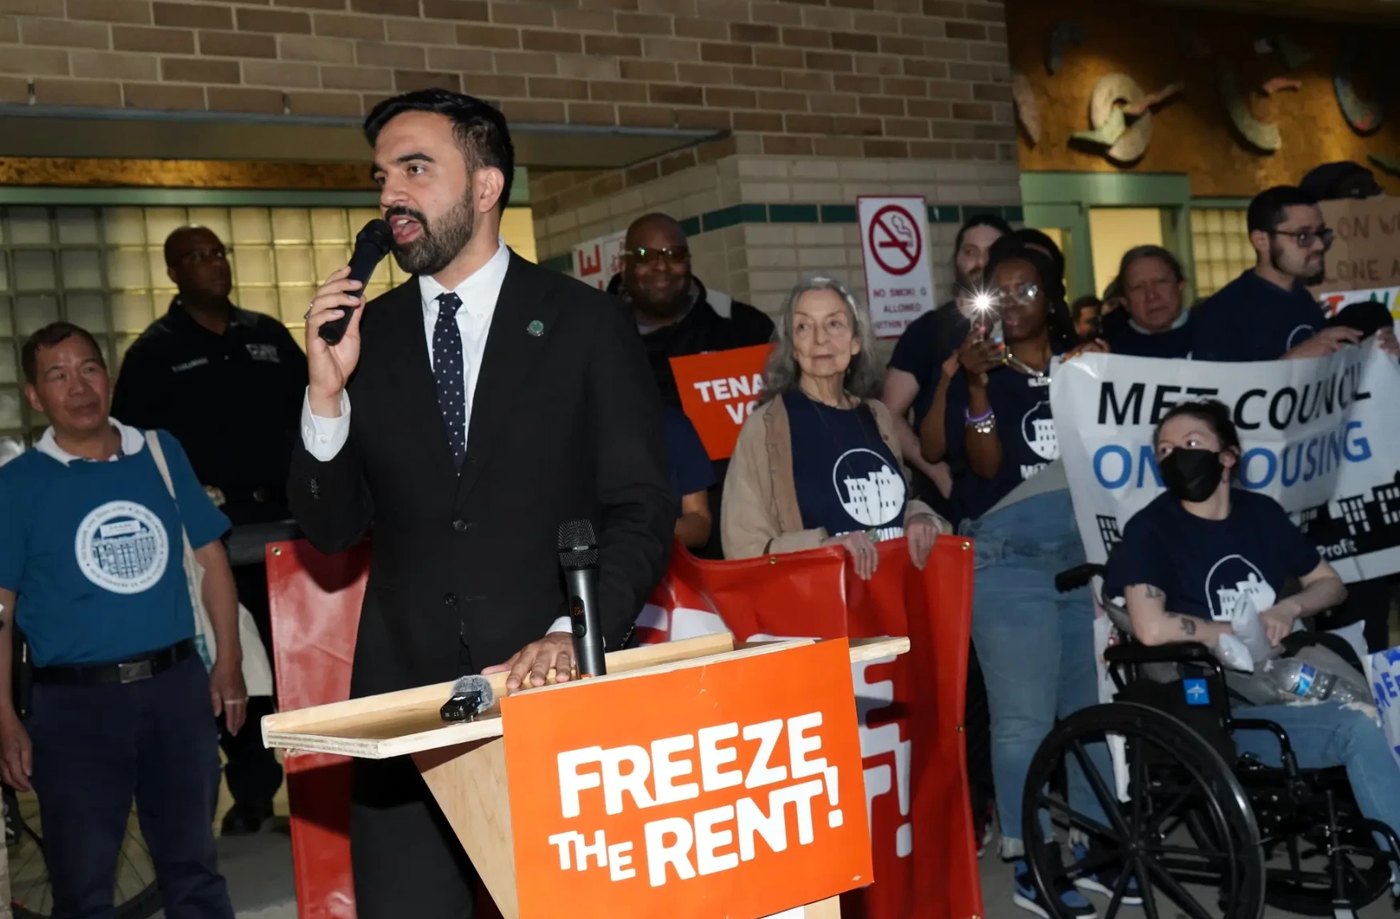
Zohran Mamdani ran for and became the mayor of New York City in large part due to a three-word catchphrase that became central to his campaign: Freeze the rent. Not reform, not stabilize, not study. Freeze. He won in what many saw as an upset over ex-Governor Andrew Cuomo. He appointed six of the nine members of the Rent Guidelines Board, and in late June that board voted 7 to 1 to freeze rents on roughly one million rent-stabilized apartments, holding both one-year and two-year leases at zero for the first time in the board's history (one member resigned over how the vote was conducted).
We have seen similar messages of housing affordability win shock elections elsewhere in the same year. In Seattle, political unknown Katie Wilson, who founded the Transit Riders Union and ran on city-owned social housing, a billion-dollar affordable housing bond and tenant protections, upset incumbent Bruce Harrell by seven tenths of a percentage point, the closest Seattle mayoral race since 1906. Detroit elected Mary Sheffield, and Miami elected Eileen Higgins, the first Democrat to run that city since 1997. Boston's Michelle Wu also won reelection in large part on her promise to make housing more affordable, but it has not unfolded that way as of yet. Boston permits at 24.6 homes per thousand residents, less than half of Seattle's rate and a fifth of Austin's. The question that I feel like has an obvious answer but needs to be asked anyway is: why does this keep winning, when the evidence against it is as clean as evidence in public policy ever gets?
Because everything you're seeing here is a short-term answer to a right-now problem. Every argument made requires a renter to accept that if their city permits more apartments starting today, filtering and vacancy and competition will make their rent more bearable somewhere around 2032. That is a real answer. It is also completely useless to a person whose lease renewal arrives in April with a number on it they cannot afford.
A rent cap is the only thing anybody offers that happens on a Tuesday. It is immediate, it is legible, and you do not need to understand net operating income or supply elasticity to know what it means. Supply is an argument, but a cap is a promise made by a politician, and a promise like that can ignite a passion an argument simply can’t.
And here is the part my own personal ideology gets wrong: the people voting for caps are not being irrational. They are correctly identifying that no one has offered them anything that helps right now. If your choice is between a policy that might slow your rent increase now and a policy that will produce apartments after you have already been priced out of the city, choosing the first one is not dumb. It’s believing in something that could improve yours or others’ circumstances. Whether that is true or not is another story.
The problem is not that voters are wrong about the urgency. It is that the cap collects on the urgency by borrowing from the supply, and the bill arrives in the same city about four years later, which is roughly one electoral cycle, which is roughly long enough that nobody has to connect the two.
Open Book Test
In June of this year, New York accomplished the backbone of Mayor Mamdani's campaign; rent was frozen on the one million cost-controlled apartments the city has the authority to freeze, just as at the same time the median asking rent in one of the five boroughs—Manhattan—hit an all-time record of $5,295, up 8% in a year, with four of the five boroughs rising and rental inventory down for twenty-four consecutive months.
Those are the same finding. One million units held at zero, and the median rent everywhere outside that million hitting a record, in the same thirty days. That is the two-tier city this paper has been describing. That's not a projection or a warning, it's data that happened in real time, and part of the inspiration for the entire spiel above.
Put the national picture next to it. Apartment completions in this country peaked at around 160,000 units a quarter in the third quarter of 2024. Then dropped to slightly above half that at 89,400 in the final quarter of 2025. Then to 74,200 in the first quarter of this year, and 77,700 in the quarter that just closed. So we are sitting at below half the peak and just around flat at the bottom.
U.S. apartment completions per quarter
The peak quarter and the three most recent ones. This is not a continuous series; the five quarters between the first bar and the second are omitted, and each of them ran above 100,000. The buildings finishing now were financed in 2021 and 2022. What gets delivered in 2028 is being financed at today’s rates and today’s volume.
Another note that might be worrisome is that the rent relief in some places that people are feeling right now (like in Austin and San Antonio), the first negative national numbers in five years, all of that supply was manufactured in 2023, 2024, and 2025 by buildings that were financed in 2021 and 2022 when money was borrowed at near free interest rates. Borrowing an old oil idiom: that pipeline has run dry. What gets delivered in 2028 is being financed right now, at these rates, and the volume being financed is less than half what it was.
So what is the solution? Mayor Mamdani has taken the hand of the government to cap prices on a large percentage of units in the largest rental market in America at around the exact moment the country stopped producing supply. Whatever happens to New York rents over the next three years is going to be the cleanest test this argument will probably ever get, running live, on eight million people, many of whom are supportive of this very policy (for now) because they feel like "The Rent is too damn high!".
I said at the beginning that I don't think crisis is the right word, and I still don't. Nothing about this is sudden and nothing about it is going to produce a photograph of calamity. It is a slow sort, of a whole generation, into people who got a golden ticket mortgage rate that has become a brand new part of their identity—like your buddy showing up with a new haircut or in a fedora—in 2020 or 2021 and people who did not. And every year we spend arguing about the price of housing instead of the quantity of it, that sorting of haves and have nots gets a little more permanent.
Housing supply, not caps on rent, is the equalizer. Every place that has actually delivered lower rents delivered them by building, and every place that tried to legislate the number you pay in rent has ended up with the same rents (or higher) and fewer buildings. The proof is in the puddin'.
The question is not whether we know what works. It is whether we are willing to let anyone do it.